Famous last words?
You can see the results here, where Coleridge councillor Anna Smith narrowed the gap further between Labour and Tories, but was unable to bridge the gap created by ministers changing the voting system for the Police & Crime Commissioner Elections from the supplementary vote (a choice of a top preference & then a second preference) to first past the post. (A single X in a box).
Comparing the Fenland turnout with Cambridge City’s turnout could have been enough. ‘In principle’ I noted at the time.
‘In principle’ given the very low number of councillors the Conservatives have at the Guildhall. All one of them. ***But*** the big unknown was how many would choose to vote Conservative over the congestion charging issue given the nearly 8,000 people who voted Conservative at the city council elections in 2023. Turns out it was enough to knock Labour off course. Furthermore, the collapse of Conservative councillors on Peterborough City Council did not translate into a collapse in votes for the PCC elections.
The highest proportion of the total eligible to vote were the non-voters – almost 75% of the electorate for the Police & Crime Commissioner Elections
Which reflects the lack of legitimacy any of the winners would have had with the electorate. Furthermore, several of you were asking about what additional benefits the PCCs added compared with other models.
This for me comes back to the need to overhaul how England is governed. Which is one of the reasons why most of the results coming back, as bad as they are for the Tories generally, feel like hollow victories unless or until a new government comes in and properly devolves significant powers and spending away from Westminster.
Cambridge City Council – Greens gain one, Lib Dems lose one, and turnout remains low in the most economically-deprived wards
By @CPElects the state of the parties is as below:
The map shows who won which wards in the 1/3 of seats up for election (14 seats), and the hexagons showing the parties and how many seats they have on the full council (42 seats).

You can also see the time graphs of each ward by Phil Rodgers here
How does Coleridge and Queen Edith’s look?
For the first time in a long time, Coleridge’s turnout beat that of Queen Edith’s – reflecting the highly-contested campaign of the former, with Green boards far more prominent than before. I said it was too close to call.
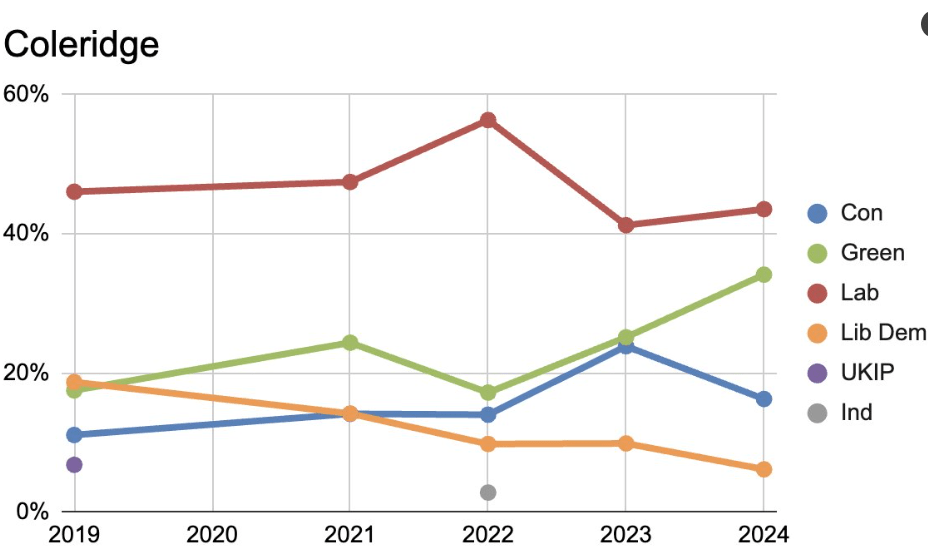
Sarah Nicmanis for The Green Party – also their MP-Candidate for Cambridge in the General Election, narrowed the gap between the Greens and Labour, continuing an upward trajectory for the third year in a row. At the same time, incumbent Cllr Tim Griffin put up a strong enough fight to increase both Labour’s share of the vote and also his own voting figures from 2023, rising from 895 votes to 1,124 in 2024. In a nutshell you don’t get to poll over 1,000 votes without doing some serious door-to-door campaigning, and thus getting a critical mass of personal-level support that goes beyond party boundaries. At the same time, Sarah Nicmanis’s vote rose from 661 to 881 votes over the same period, so again familiarity with residents comes into play with door-to-door campaigning.
There’s no Coleridge division for the county council elections next year – it got split in a review just over a decade ago, the southern half into Queen Edith’s, the northern half into Romsey, and part of the eastern section into Cherry Hinton. Prior to that point, the two councils aligned. The Tories in their wisdom changed it.
Queen Edith’s – Immy Blackburn-Horgan returns with a larger majority
Cllr Blackburn-Horgan increased both share of the vote and total numbers of votes from the by-election last year, from 35% to 43% of the vote, and 745 to 1,123 votes. The other three parties feel back slightly as a percentage share, but gained slightly in terms of total votes – Labour’s Beth Gardiner-Smith (daughter of former Romsey Councillor & Mayor of Cambridge, Barry) gaining an additional 80 votes on top of the total that her predecessor, Thomas Ron gained last year.
Labour stand firm against challenges from Independent candidates
To the delight of environmentalists, Cllr Dave Baigent, a prominent pro-active travel campaigner for Labour, managed to poll over 50% of the vote in ‘Red Romsey’.
At the same time, in second place were The Greens with Iain Webb polling 524 votes on top of Cllr Baigent’s total of 1,433. This means that the Greens polled more than the two candidates standing on a pro-motoring/anti-GCP platform (Conservatives, and Independent Will Bannell – the latter confining the Tories to last place with a more active campaign starting from scratch).
In Castle Ward Antoinette Nestor fought off a spirited campaign from David Summerfield who leapfrogged into second place (from fourth), in what can be a difficult ward to campaign in given the turnover of student population. The Tories brought up the rear with a “Worse than Puffles the Dragon Fairy” award for polling fewer than the 89 votes that the dragon got in 2014. They polled 88. Another Conservative joined the ‘Worse than Puffles’ club – in Newnham ward where they polled 84 votes. That contest also saw the continued decline of the Liberal Democrats’ vote where county council leader Cllr Lucy Nethsingha failed to keep hold of her city council seat, pushed into third place by The Greens and Labour.
This could be problematic for the Liberal Democrats next year in the county council elections – they will need to do something big if Cllr Nethsingha is to keep hold of her county seat in 2025.
Small parties fail to make a mark
Also joining the ‘Worse than Puffles’ club in the 2024 elections were the Communists with 42 votes in Abbey Ward (always going to be a tough sell against The Greens when the latter are in opposition at the Guildhall), the Freedom Alliance in Petersfield with 44 votes,
Increasing participation and turnout in the most economically-deprived wards in Cambridge
Abbey, Arbury, King’s Hedges, and Trumpington all come up as having high levels of economic deprivation on the data sets collected by Cambridgeshire Insight. Nearly half of the voters in regularly-contested and relatively affluent West Chesterton turned out, while under a third in Abbey and King’s Hedges did so – even though the latter was contested by the Conservatives following their by-election victory last summer.
What is the role for wider civic society to help increase the participation and turnout in those wards? Is it simply a case of putting on events for candidates to meet the voters? (Easier said than done!) Or putting posters on supermarket notice boards? (Again, easier said than done!) Or is it ultimately up to the political parties to ‘do better’? Alternatively, does the voting system incentivise the concentration of activists into a handful of ‘swing’ seats? What does it take for an opposition party to turn an opponent’s ‘safe-as-castles seat into a marginal one? (And what does it take for a party to turn a recently-won seat into a safe seat? i.e. what are the common factors?)
With the general election less than eight months away, can we get some hustings events with the candidates in each of those wards rather than concentrating them in the city centre?
If you are interested in the longer term future of Cambridge, and on what happens at the local democracy meetings where decisions are made, feel free to:
- Follow me on Twitter
- Like my Facebook page
- Consider a small donation to help fund [things like venue hire and leaflet printing as well as…] my continued research and reporting on local democracy in and around Cambridge
