Papers published by Cambridge City Council for a meeting on 14 January 2025 will discuss what the statistics say – and you can throw your public Qs in too!
See the following:
- Planning and Transport Scrutiny Committee papers for 14 Jan 2025
- Item 5 and annexes for housing construction stats
- Item 6 on the Council’s views on East West Rail (another thing to as PQs about)
- Item 7 on the Greater Cambridge emerging local plan 2031-40
- City Council guidance on tabling public questions
What the housing report says
For starters, the report writers and council officers should consider a ‘dashboard’ summary sheet at the front of such dense reports. Because the things that councillors and the general public are more likely to be interested in are buried in the papers – i.e. page 29 of the 112-page documents pack.
The key findings are in paragraph 4.1.5 and include:
- Combined annual housing completions in 2023-2024 for Cambridge City and South Cambridgeshire District, was 1,582 dwellings.
- The annual delivery rate required over the plan period 2011 to 2031 is 1,675 dwellings a year. The average annual delivery rate between 2011 and 2024 is 1,683.
- 523 affordable dwellings completed in Greater Cambridge in 2023 – This is 33% of all completions which is above the plan period average of 31%. However, only 20 of these affordable dwellings were in Cambridge. This low figure was due to demolitions reducing the net increase, schemes completing in the previous year and edge of Cambridge large sites building new homes over the border in South Cambridgeshire.
- The total number of completions in Cambridge & South Cambridgeshire between 2011-2024 is 21,879 dwellings/units. (Households in flats and houses irrespective of the number of people in them).
- Employment floor space incl offices and sci-tech space: In the 2023-2024 there was a net gain of 12,569 sqm of employment floorspace in Cambridge and a net gain of 3,540 sqm in South Cambridgeshire including:
- 11,286 square metres of R&D space on the Cambridge Biomedical Campus
- 6,866 square metres office development (incl the Unity Campus?) on the Sawston Trade Park (which should have much better active travel links to Whittlesford Parkway Station and the Imperial War Museum at Duxford)
- In Cambridge, there is 232,331 sqm of employment space either allocated or with permission at 31 March 2024, of which, 113,784 sqm has detailed planning permission ***This is the unbuilt backlog***
- There was a decrease of 7,707 square metres of retail floor space – mindful of the huge and continuing social changes in retail combined with the sci-tech bubble meaning land owners and speculators have been converting sites like The Grafton Centre into sci-tech bubble spots.
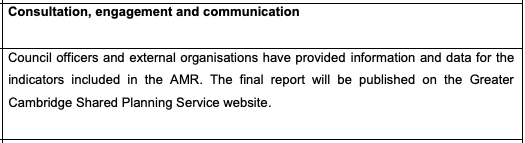
“Can the city council do something better than what the report says on communicating the important information within it?“
Above – from p31 on in the meeting papers pack.
Even some info-graphics and a few charts showing things like:
- Planning permissions per year over the past decade
- Housing completions per year over the past decade
- Affordable housing completions per year over the past decade
- Affordable housing units lost (through council house sales, and through demolition of obsolete/substandard accommodation) per year over the past decade
- Changes in the council house waiting list per year over the past decade
- Population estimates for the city per year for the past decade (and also if possible by ward)
The appendices have the details – and RAG risk ratings

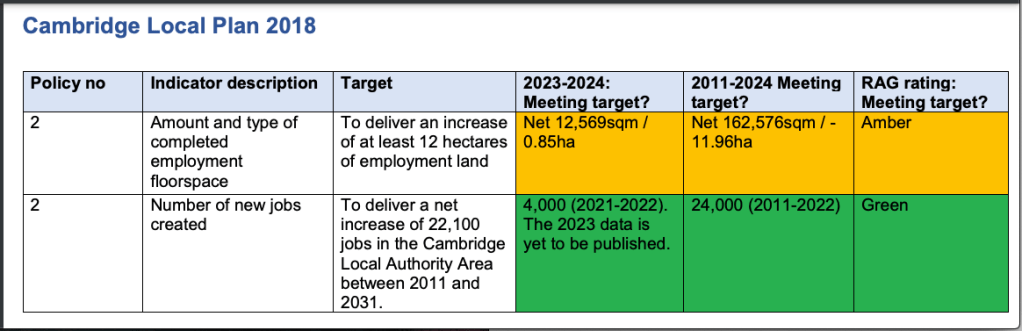
The tables – in particular the Indicator Description enables councillors and the public to look at what is being measured. Choosing what to measure and what to ignore is a hugely influential position to be in because if you choose not to measure something, you can say to your opponents:
“We do not collect information of this nature so cannot respond in detail / There is no evidence to show that [bad stuff is happening]”
Feel free to go through the table and pick out the things that you have issues with, and email your local city/district councillor (see https://www.writetothem.com/) if you feel so moved to do something about it or want to know more.
The tables pick up a number of interesting things too
- Nearly 22,000 new homes in Cambridge and South Cambridgeshire since 2011, of which:
- 4,820 are within Cambridge City (not a small number – about ten percent of the city’s total housing stock)
- 6,363 on the ‘Edge of Cambridge’ – i.e on major sites that straddle the Cambridge and South Cambridgeshire border
If we tweaked the boundaries of the city to cover all of the edge-of-Cambridge sites, we’re looking at an increase of 20 percent in housing stock/volume. Not surprisingly the census of 2021 showed a population increase for Cambridge of 17.6% from 2011. That’s 21,800 people (the population rising from 123,900 to 145,700) people.
It’s not as simple as saying “Oh, that’s about 4.52 people per new dwelling” when trying to account for the drivers of population growth. For example the number of babies born in Cambridge every year (hovering around 1,300 per year according to Cambridgeshire Insight – though note the overall decline across the county since 2012) don’t automatically result in a family/household moving house as a consequence. The population density of an existing household will have increased instead. Furthermore, the headline figures don’t tell us about mortality rates and what happens to the homes of those that passed away in that time period. Note the commentary on ageing by Cambridgeshire Insight here. In a city with a high population turnover and a housing crisis, trying to get a clear picture is challenging. Not least for those trying to plan for future school places and care for the elderly.
Appendix 2 – the important headline statistics that should be easily accessible
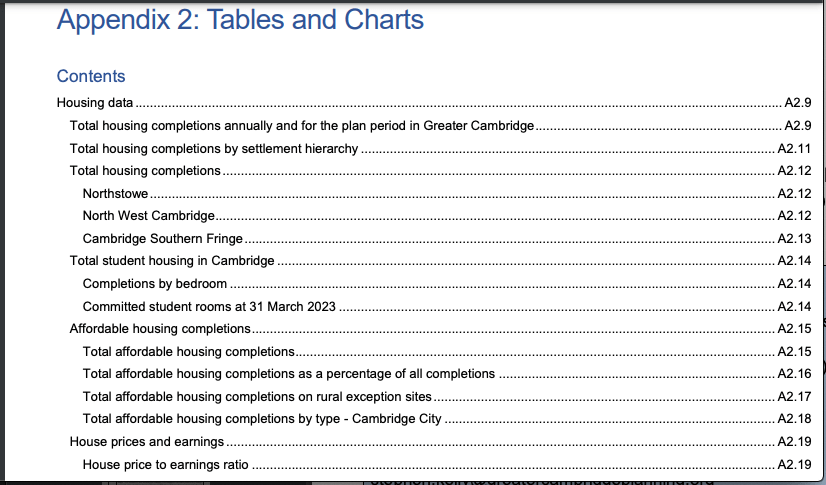
Above – from Item 5 App2 – note that screenshot goes into a list of eight pages
If anything, the most important headline figures from the contents page should be turned into an infographic-style diagram by council officers and regularly attached to council papers so that councillors and the public become more familiar with the key data and what they mean. Because more than a few of those indicators remind me of the old National Indicator Set from the defunct Local Area Agreements that I mentioned in this recent blogpost – numbers that help paint a picture of a local area, or at least stimulate questions that need to be asked of decision-makers, the powerful, wealthy, and influential.

Note the contributions from developers to infrastructure remains a contentious issue. Because longer term residents have not forgotten the Cambridge Station debacle.
Above – from BBC Cambridgeshire 20 Oct 2005 – the mill building is now expensive private apartments.
What happened to that promised centre you may ask? Olly Wainwright of The Guardian told the story here in 2017 of how the initial firm involved in redeveloping the site went into administration after ‘over-stretching’ themselves during the banking crisis.
“From then on, the quality of the project was progressively watered down and obligations renegotiated, each regressive step argued on the basis of the straitened economic climate in the wake of the 2008 financial crisis.”
Oliver Wainwright, The Guardian, 13 June 2017
It feels like an annual kick in the stomach when we read every year how the successor firm is listed as one of the most profitable in the county. Privatising the profits, socialising the losses. But then the problem is the system and how it has been corrupted – as the Grenfell Inquiry revealed. See also the Flying Pig Pub site where the developer, having crushed the community campaign to save the pub subsequently sold off the asset and banked the planning uplift.
Which reminds me – any councillors know who now owns the Romsey Labour Club?

Interesting given that in the late 2010s the previous owner was looking for over £2.5million for the site.

Above – earlier iterations had the limit at £3million
“You got distracted and started ranting”
These matter because of the loss of community and leisure facilities
Which reminds me – there’s headline data on the delivery of new community space:
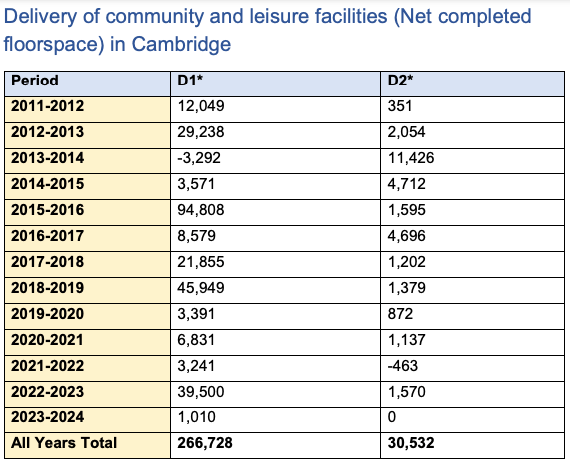
Above – why aren’t the tables in App2 in csv/xlsx format? This from Item 5 App2 p100
“*D1 uses (Non-residential institutions) include clinics, health centres, crèches, day
nurseries, day centres, schools, art galleries (other than for sale or hire), museums,
libraries, halls, places of worship, church halls, law court. Non-residential education
and training centres.”
*D2 uses (Assembly and leisure) include cinemas, music and concert halls, bingo
and dance halls (but not night clubs), swimming baths, skating rinks, gymnasiums or
area for indoor or outdoor sports and recreations (except for motor sports, or where
firearms are used).”
Note how these can be gamed. As former Cllr Sam Davies asked, it would be good to see a breakdown of each one. Because ‘Non-residential education and training centres’ could easily be private cram colleges or language schools that don’t actually provide new facilities for the city – rather the failure to provide for the teenagers means that there is excess demand on key facilities such as swimming pools. Hence my call for the expansion of the Cambridge BID to cover private schools, cram colleges, and language schools to pay for a new generation of services and facilities for children, teenagers, and young adults in and around our city.
Hotel space
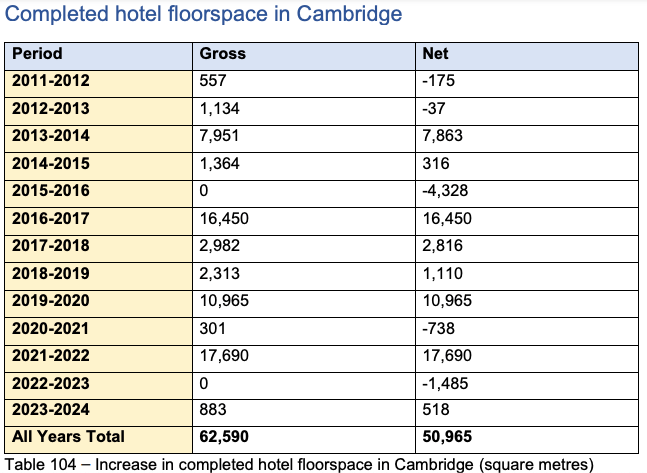
Again, it would be good to see what this looks like in terms of number of hotels, size, standard, and distribution.
One big white elephant – data on Air-BnB / Short Term Lets / Aparthotels
Please can we see some robust data on these otherwise we’re stuck with the ‘lack of evidence’ problem.
I’ll look at the traffic and transport data in a separate blogpost.
If you are interested in the longer term future of Cambridge, and on what happens at the local democracy meetings where decisions are made, feel free to:
- Follow me on BSky <- A critical mass of public policy people seem to have moved here (and we could do with more local Cambridge/Cambs people on there!)
- Like my Facebook page
- Consider a small donation to help fund my continued research and reporting on local democracy in and around Cambridge.

