
I had a brief look at the draft report back in July 2024 (see here), after which it has since been updated and will now be discussed and scrutinised by the Combined Authority’s Overview and Scrutiny Committee next week
It was such a monster of a report that I didn’t really pick up much that didn’t surprise me. Now that the finalised reports are now public (see the appendices at item 9 here) it’s worth having a much closer look.
TL/DR?
Click on the PDF 614 KB briefing paper by Jules Lent, Head of Policy, Insight and Performance, and colleagues.
“What is the report about?”
To use their words, “[the report provides] a core evidence base and interactive dashboard with open data repository to aid future investment decisions, policy and strategy making, and business case development,”
It’s actually far more than a report – it’s actually the sort of thing that I’ve spent the past decade and a half calling for…
It is the interactive dashboard that is the most interesting bit <<– Click on here and have a browse. If that doesn’t make sense, see the user guide here
…Hence I’m ***really pleased*** that the CPCA and Cambridgeshire & Peterborough Insight have created this
(Rare praise indeed!)
In a nutshell, decision-makers need to have the evidence-bases at hand in order to scrutinise the people making the recommendations. Those who are minded and curious enough will be able to browse through and interrogate the data to whatever level of depth and detail they desire.
There are a vast number of data sets that underpin the dashboard – data that can be searched, processed, sorted, and filtered in an instant – the sort of thing previous generations of decision-makers would love to have had.
Example: Health inequalities in Cambridgeshire and Peterborough
I’m interested in Cambridge, so I want to zoom into the data about Cambridge rather than the CPCA region. The dashboard allows me to do this by clicking on the health and wellbeing top tabs, and scrolling down to one of the illustrated data sets in the form of a county data map (as shown below left) – such as average life expectancy at birth. I click on ‘unlock map’ and zoom into the geographical area of Cambridge within the county – as below-right.
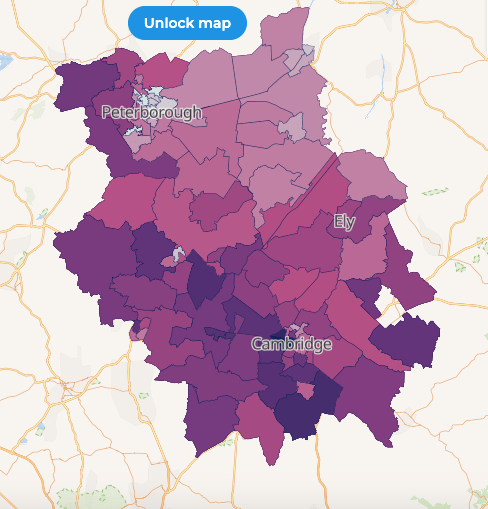


Above – from the live dashboard link on p2 here
One thing that is clear is the geographical units for this data set is at ward level – even though the data map shows the *geographical* rather than the council administrative designations. Hence ‘Barnwell’ and ‘Chesterton’ appear, but not ‘Abbey’ or the separate East and West Chesterton labels. Intuitively the difference between the colour that Newnham hovers over, vs the area above Chesterton (King’s Hedges) immediately says ‘Look here!’
Hover the mouse icon over each ward and the statistics come up. For King’s Hedges ward the average life expectancy at birth is only 62 years for females. For males it’s 61 years. Which is grim. For Newnham ward it is 77 years and 73 years respectively. That is a 15 year difference in average life expectancies over a distance of two miles. Or about the distance from St John’s College private school to King’s Hedges Primary school. We may share the same city but we don’t share the same opportunities or barriers.
“That’s scandalous”
But we’ve known about it for decades. Even the likes of Cambridge Ahead have identified the inequalities as a major issue for Cambridge that’s stopping the city from achieving further growth. Hence the recent co-ordinated announcement here to ministers.
Pick another issue.
“How is Cambridge doing on…energy efficiency of homes?”
Good question – my old policy area of sustainable new homes from my civil service days in….2007/08. Intuitively, the more recently-built homes should have Energy Performance Certificates, and any of them built after 2008 should have been built to a standard where energy performance assessors signed them off at level C or above.
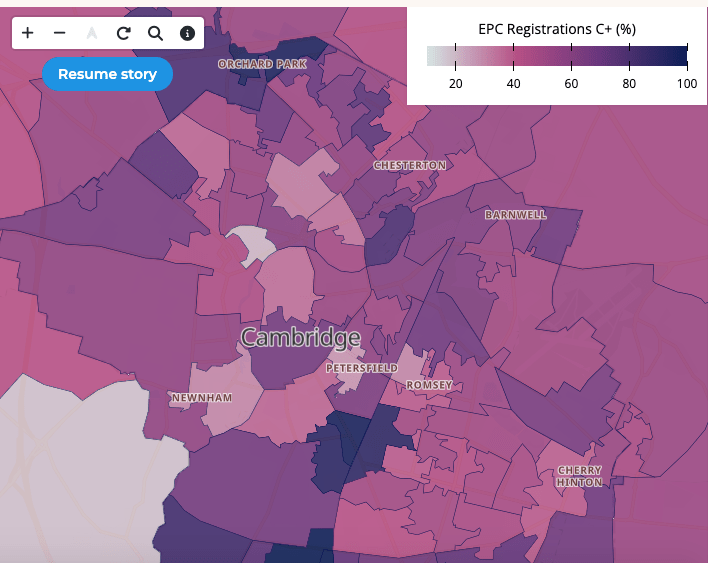
Above – detail of the percentage of homes with EPC registrations at C or above
Note the data is disaggregated further into sub-ward levels – ‘Lower Super-Output Area’ as referred to in public sector statistical circles. You can see the developments close to Cambridge Railway Station have had an impact on the results – the darker shading indicating that more homes have had EPC assessments and they have been at C or above. Ditto Orchard Park at the top. It reminds us however, that there is a huge retrofitting task ahead to improve the energy efficiency of our residential buildings. What the map helps local policy makers decide is which parts of the city to begin with. That will also be affected by information on ownership of properties, through to income and poverty data. For example the policies councils and/or ministers might use for home owner-occupiers won’t be the same as those for institutional private landlords with multiple properties scoring below level C. Evidence-based policy-making? That. Only this example shows that while the broad principles and national framework can be set in Whitehall, the local application and local delivery must be decided locally – and those local councils must be properly empowered and resourced to do this.
“There’s a 200+page paper document report – what does that say?”
These are at Item 9 – appendix A for the text-heavy version, appendix B for the pictures and diagram version. As I mentioned at the top, the summary in the briefing report (the 614k document) from page 4 onwards actually lists the big issues under the themes:
- Tackling inequalities
- Place
- Connectivity
- Business and Enterprise
- Health and Wellbeing
- Workforce, jobs, skills
- Wildlife and Nature
- Net Zero and climate
They also list the ‘stubborn challenges’ identified in 2022 – noting that these are CPCA-wide, not just Cambridge ones.
- Barriers to competitiveness and good growth, including pressure on supporting infrastructure including digital, transport, water and affordable housing.
- Persistent inequalities in health, income and access to opportunities
- Retail decline and lack of investment in town and city centres
- Climate change adaption and carbon reduction
- Pressures on biodiversity, environmental assets and natural capital, including access to green space
- Concentrations of low skill levels and areas of low provision
- High vacancy levels and recruitment challenges in key sectors
Key findings of the model and data
These are on pages 192-193 / 197-198 of the PDF of the paper report (Item 9 appendix A) and amongst other things highlight the further data collection exercises that are needed. For example you could go through the contents pages at the start of the document and probably suggest a few data sets that might be useful. Or shortcomings with existing data sets.
“Such as?”
Adult education – there are significant limitations with the data and analysis
Your Brexit Bonus makes it harder to compare the UK with anywhere else – eg EU countries like in the olden days. But when we dig around to try and find some headline comparators the state of the UK is shocking. Take the EU participation rates for 2022 for adults aged 25-64 (Which effectively takes out young adults in full time higher education)

Now let’s compare it with the abysmally-named Learning and Work Institute (which for me gives it too much of a vocational focus rather than encompassing the love of learning)

Above – for 2023 the figure was 28 percent of adults saying they were currently learning.
In Sweden the figure was over 70% and for the Netherlands over 60%.
I’m not sure what’s happening with the Cambridgeshire and Peterborough comparators but the participation rates are off the scale for the wrong reasons – are we really saying that fewer than 6% of adults are participating in further education and skills? It doesn’t feel like we’re comparing like with like.
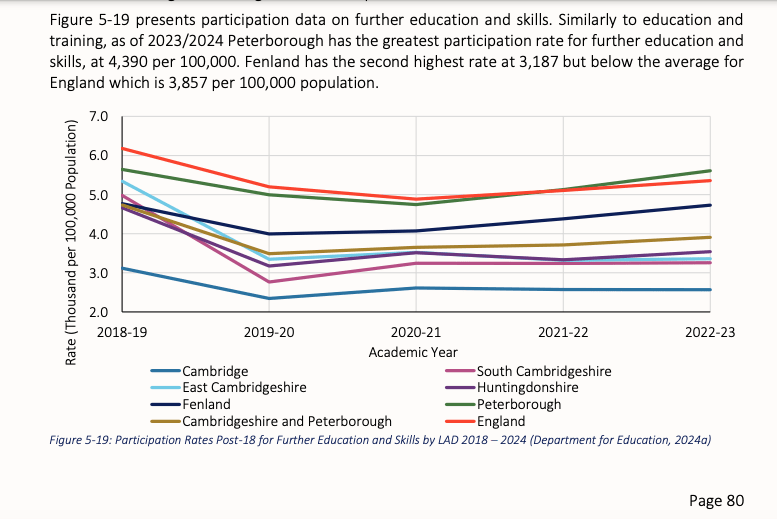
Above – p80/85pdf
Given the chronic and well-documented lack of funding for the adult education sector (See this plea from FE Week in mid-2024) I don’t think Cambridge or the Combined Authority area has a good story to tell on lifelong learning and adult education. I think employers irrespective of sectors should be embarrassed and ashamed collectively at how little of their revenues they reinvest into their workforces, and how little they provide for the construction of new learning facilities that would not just benefit their own businesses and institutions, but wider society. As I said to the Cambridge Biomedical Campus representatives nearly a year ago: ‘You can’t build the biggest employment site in Cambridge and not have a lifelong learning centre on it’. Something I still find astonishing as earlier this week when I bumped into an old classmate from the early 1990s, we both said we’d jump at the chance to learn something in a sci-tech field – even though in my case my options are limited by chronic illness and disabilities. And yet despite years of raising the shortcomings to politicians of all major political parties, and to influential and wealthy individuals from commerce and academia, nothing. Which for me reflects a wider failure of decision makers not only to engage consistently and routinely with the people of our county, but also the lack of curiosity and diversity within the institutions themselves. After all, how are senior executives going to know the first thing about what people on low incomes, in unstable employment, or with chronic health problems have to overcome to take up what few opportunities are offered? And remember the CV19 Inquiry revealed just how damaging that lack of diversity in decision-making circles can be. In a city full of private schools along with the baggage that the University of Cambridge comes with, that is something that should be at the forefront of the minds of decision-makers. Is it?
It will be interesting to see how the mayoral candidates challenge employers and institutions during their campaigns.
Food for thought?
If you are interested in the longer term future of Cambridge, and on what happens at the local democracy meetings where decisions are made, feel free to:
- Follow me on BSky <- A critical mass of public policy people seem to have moved here (and we could do with more local Cambridge/Cambs people on there!)
- Like my Facebook page
- Consider a small donation to help fund my continued research and reporting on local democracy in and around Cambridge.

