The Patron of the RSA made a series of comments introducing her guest speaker Prof Robert T Putnam at the RSA’s Annual Patron’s Lecture
You can watch to the Princess Royal’s introduction here, followed by Prof Putnam’s lecture.
The event was also accompanied by the publication of an interim academic paper:
“Prof Putnam’s books have provided insights into what we might call civic life, and crucially how we might rebuild that. Social infrastructure is just as vital as the physical infrastructure. Strong communities built on relationships and mutual support are fundamental in tackling all sorts of things that affect people’s life”
HRH The Princess Royal to the RSA, 24 March 2025
Prof Putnam’s observations
Could the same have been said for the UK in 2019?

Above: Prof Putnam to the RSA, 25 March 2025
Prof Putnam’s book Bowling Alone (summarised here) was read by the advisers of the current US President which then formed the template for a populist response. Hence he stated in his RSA lecture that the polarised, atomised, unequal USA that exists today was not created by the current US President, but rather was and is being exploited by him & his administration. That general election result, said Putnam, revealed the threats resulting from growing social isolation and a growing class gap. Which may sound familiar to us in the UK today. For example the University of Cambridge shared an article in the Financial Times / FT about
“…how the University is working with government and partners across the city on plans for Cambridge to turbocharge the UK economy.”
Above – Cambridge University (LI – 24 March 2025)
…only for that article to be hidden behind a paywall. Hence I responded:
“Not a good look having such articles locked behind paywalls given that your plans have a huge impact on many residents of the city. Please ensure future pieces are free to access for everyone, irrespective of their incomes and wealth given the chronic inequalities in our city.”
Above – Antony Carpen (LI – 24 March 2025)
Sir Nick Clegg speaks
The old Behavioural Insights Team’s analysis.
Once part of central government, then spun out and privatised, the BIT was taken over by the charity NESTA – the National Endowment for Science, Technology, and the Arts, formerly a part of the DCMS during my civil service days. They produced a new report published on the same day.
Social capital in the United Kingdom: evidence from six billion friendships
You can read the press release and play with the data here
On Economic Connectedness – the percentage of people from low income backgrounds who have friends from higher income backgrounds, the unequal geographical distributions are striking.

Above – BIT (2025) Social Capital in the UK
Why is it that Barking & Dagenham has under 40% of its low income residents with friends from higher income backgrounds, yet two councils to its north east in Brentwood it’s over 58%, and one extra council along in Chelmsford it’s over 60%?
In Cambridgeshire the polarisation is stark between East Cambridgeshire (58.5%) and Fenland (43.5%). Cambridge (55.5%) vs Peterborough (41.4%) also shows there is a lot of work to do in the two largest settlements in the Combined Authority area.
“Low-income children who grew up in the top 10% of the most economically connected local authorities in England earn 38% more per year on average (£5,100) as adults relative to low-income children in the bottom 10% of local authorities.”
Above – BIT (2025) Social Mobility in the UK
I’m now wondering where the list is of local authorities in order of economic connectedness!
“Residential segregation often limits the amount of cross-class interactions and connections in neighbourhoods and schools. Workplaces and hobby groups promote more cross-class friending among their members, but people typically only form a small portion of their friendships in these settings.”
Above – BIT (2025) Social Mobility in the UK
One thing that’s hard to avoid in Cambridge in the 2020s is intrusive advertising for private schools. Personally I find it particularly offensive when the adverts are splashed over buses that serve some of our most economically-deprived communities in the county. There’s no right or wrong answer to the root issue which is the existence of elite private schools in the first place – for much of the 20th Century there were intense debates about the potential nationalisation of the entire sector. This was last considered seriously by Harold Wilson’s Government which established the Public Schools Commission to investigate – and you can read their 1968 Report here. Segregation by income – and by extension social class, inevitably has an impact on day-to-day interactions between children of families from economic backgrounds. This also reflects the ambition of the late John Prescott when he was Deputy Prime Minister 20 years ago – during my first year of my civil service career.
“Our collective challenge now is to build the right homes in the right places with the right infrastructure and deliver truly mixed communities – mixed in terms of tenure, income, and meeting different housing aspirations”
Deputy Prime Minister John Prescott to Inside Housing, 04 March 2005
Political and social activism
The university cities stand out prominently in this dataset
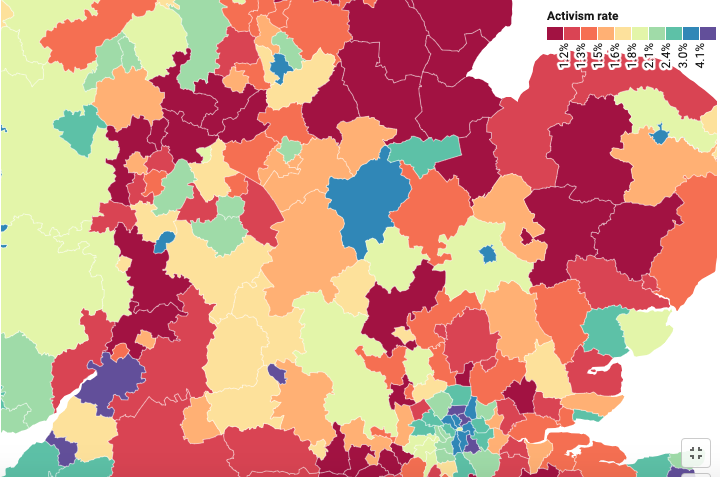
Above – BIT (2025) Social Capital in the UK
By that I don’t just mean the ancient two, but the industrial and early post-war era civic universities and their cities such as Bristol, Nottingham, York, Manchester, Liverpool, Leicester, Norwich, and Brighton. In Liverpool’s case the much high volunteering rates in the surrounding metropolitan boroughs compared with the wider region (NW England) indicates a factor/factors that cannot be explained by the students alone.
In Cambridgeshire the polarisation between Cambridge and the rest of the county is striking both in terms of the percentage of residents active (A population of around 150,000 with a volunteering rate of 3.7% indicates over 5,000 residents active in social and political campaigning). The other interesting stat is the number of activist groups per 1,000 population. Cambridge has 27 per 1,000 population, while Peterborough has 13. That doesn’t necessarily mean more is better. Back in 2013 I noticed that Cambridge had a plethora of standalone groups and campaigns that did not appear to be talking to each other at the time – and called for some consolidation in number.
While the data can show interesting insights, it’s the local people for each area that can provide the in-depth explanations as to the reasons behind the numbers
This is one for county council candidates to have a look at – and also combined authority mayoral candidates too. In Cambridgeshire & Peterborough’s case, the large geographical area and the very different economies and demographics of different parts of the sub-region mean that coming up with policies is that much harder because what might be suitable for a booming/overheating city such as Cambridge will not be suitable for somewhere like Fenland with woeful transport connections being a particular challenge hampering connectivity.
The challenge for institutions
This was put to combined authorities by the Bennett School of Public Policy in Cambridge which has been doing some research on all things social capital. What makes things particularly depressing is that the recent policy announcements from senior Cabinet Ministers – in particular on cuts to disability welfare support, to jobs in the civil service, and more, feel like they are doing the opposite when it comes to building up social capital. Because given how the Personal Independence Payments enable recipients to overcome barriers in day-to-day living, those cuts will inevitably mean that some of us (for I’m one of the recipients) won’t be able to take part in nearly as many things because things like public transport/bus fares become unaffordable.
Given the recent negative headlines, it’s hard not to think this will have had an impact on the recent opinion poll from Labour Together indicating the Tories are in the lead for the CPCA election. (See the tables via here). Hence the alarm in some Labour-leaning circles at the refusal of ministers to table the legislation needed to reverse the changes made by the Tories to the voting system for CPCA elections. If Labour don’t win the CPCA election, ministers will only have themselves to blame for a campaign that, compared with previous campaigns has had the most number of senior ministers turning up to help including earlier on, the Prime Minister. That’s a lot of ‘Political Capital’ at stake.
Just over five weeks and counting to polling day.
If you are interested in the longer term future of Cambridge, and on what happens at the local democracy meetings where decisions are made, feel free to:
- Follow me on BSky <- A critical mass of public policy people seem to have moved here (and we could do with more local Cambridge/Cambs people on there!)
- Like my Facebook page
- Consider a small donation to help fund my continued research and reporting on local democracy in and around Cambridge.
On the importance of hobby and activity groups: Opening a new city orchestra and community music school for adults like the Mary Ward Centre in London could go a long way – especially if it was located close to a major public transport interchange.