Furthermore, do they discuss and share what specific policies and actions they need from each other?
Public policy note: This is ***very complex*** and not easy to do at all.
When I started off in the civil service back in mid-2004, many old hands, some of whom started their careers in the 1970s, told me how often the policy cycle repeated itself. So when I look at the first part of Strong and Prosperous Communities White Paper [i.e a major statement of Government policy], which was published in 2006 by the last Labour Government, many of the section heading below (with page numbers) may sound very familiar to those of you looking at the Levelling Up White Paper published in early February 2022. (Now who feels old!?!)
- Introduction: strong and prosperous communities 15
- Responsive services and empowered communities 25
- Effective, accountable and responsive local government 47
- Strong cities, strategic regions 67
- Local government as a strategic leader and place-shaper 93
- A new performance framework 113
- Efficiency – transforming local services 133
- Community cohesion 151
- Steps towards implementation 167
And the themes in Volume 2?
A – Community safety 5
B – Health and well-being 13
C – Vulnerable people 21
D – Children, young people and families 31
E – Economic development, housing and planning 39
F – Climate change 47
G – The third sector 55
The contemporary historical context
So run down was local government that when Tony Blair won power in 1997, one of the most straight-forward ways of ‘getting things done’ from a ministerial perspective was simply to bypass local councils and establish new agencies of central government whose chief executives were appointed by, and accountable to ministers. This was combined with a very burdensome reporting system for local councils to demonstrate that they were making progress in return for substantially increased funding for the sector.
“At present there are between 600 and 1,200 indicators against which areas must report to central Government.”
Strong and Prosperous Communities White Paper, HMSO, p122, para 6.33
“What’s an indicator?”
In public policy-making, it is something that central government wants you to measure – i.e. collect data on, and report back those measurements. In the mid-2000s these included things like:
- Number of homeless or vulnerably housed people per 1,000 population
- Percentage of school leavers achieving a set target of grades in their exams – at the time it was 5 GCSEs at grades A*-C including English and Maths.
- Percentage of teenage pregnancies in teenage girls
- Percentage of children in receipt of free school meals
Every upper tier level (Shire/County) council or unitary council has a statistical research unit that collects and analyses local data sets in Cambridgeshire (inclusive of Peterborough Unitary), we have Cambridgeshire Insight.

Above – from the landing page of https://cambridgeshireinsight.org.uk/
Imagine you’re the leader of a local council and a minister has come to visit. You need to be able to make the case to the minister for whatever actions (all too often more money!) you’ve been calling for, and need the data to back this up. E.g. “We need more money not just because of past population rises but also because of projected population increases – here’s the data”
Having accurate and up-to-date data is incredibly important in policy-making. For a start it enables ministers to direct resources towards those areas where the data on poverty and multiple deprivation demonstrates greatest need. Furthermore, it enables MPs (and through them, constituents) to hold ministers accountable for how they spend tax payers money. Which is why *what ministers choose to measure and collect data on* is a very important Political issue. Because if ministers are not requiring specific data sets on something, then unless a well-resourced outside organisation is doing so, there is ‘no official data’. Which means ministers have the excuse of doing nothing.
A contemporary history lesson in a few paragraphs: Life in the 1990s just before the internet became mainstream.
One of the most oft-quoted case studies at the time was that of teenage pregnancies. 14 years before Strong and Prosperous Communities was published, the Secretary of State for Social Security (or what was left of it), on the back of winning the 1992 General Election, stood up and made this very provocative speech, dripping with bigotry.
Above – Peter Lilley in 1992.
Further more, the above speech was just three years after the Conservatives had brought in Section 28 of the Local Government Act 1988 that had a huge impact on my generation of teenagers when it came to Sex Education and the many euphemisms and acronyms that adults came up with to discuss something that too many people in power at the time were far too squeamish about.
“[P o r n] was telling us what sex was when the only way we were educated about it in school was via condoms on bananas and photos of untreated gonorrhoea… everyone who should have been telling me about sex was too embarrassed to…”
Annie Lord – The Guardian [today] 12 Feb 2022.
The pre-internet age of Sex Education was one that seemed to prohibit images of actual people / bodies to teenagers in exactly the same way that the ‘Don’t do drugs’ message was one that was full of the slogans but nothing on what the drugs that we weren’t supposed to be doing actually looked like. Until the tragic death of the then 18 year old Leah Betts in November 1995. What was all the more striking about that case at the time were the backgrounds of Leah’s parents – one a community nurse and another a former police officer. Such was the news coverage at the time, along with pressure from professionals and wider society that ministers were forced to change their strategy in a very big way, and having to acknowledge that educating young people on what drugs were/are, what impact they have on the mind and body in both short & long term – including the short term effects of highs, chilled out, and so on, were on posters all around school. But it only went so far given how local council and community health budgets had already been cut to the bone after over 15 years of public sector cuts.
When actions by one part of the public sector can have a knock-on effect on a seemingly unrelated indicator overseen by another organisation
Fast forward to 2006 and one of the oft-repeated examples of why it was good to let local areas choose their own priorities and methods of dealing with social issues was to do with the indicator of teenage pregnancies. Several areas had found that levels of teenage pregnancies fell where education authorities had been successful in persuading girls of school leaving age to stay on into further education – and seemed to have a greater impact pound-for-pound than spending money on contraceptives, or as was put more pejoratively “Throwing condoms at teenagers”.
It’s never as simple as moving public sector funding from one area to another. Money allocated by the Government to the NHS doesn’t get handed over say from a local NHS organisation to a local further education college because the latter seems to have a greater impact on a target allocated to the former. Which inevitably became a source of frustration.
One of the things that was holding local councils back was the amount of funding from central government that was ‘ring-fenced’ – i.e. it could not be spent on other things. It makes for good headlines. “This extra funding is ring-fenced so it will only be spent on this headline-grabbing issue”. One of the things that goes along with such funding is that ministers want to know whether it has been successful or not. It still happens – take this announcement:
“In 2021 to 2022 the total public health grant to local authorities will be £3.324 billion. The grant will be ring-fenced for use on public health functions. This may include public health challenges arising directly or indirectly from coronavirus (COVID-19).”
Public health ring-fenced grant 2021 to 2022: local authority circular
What the announcement misses is the decade of cuts to public health budgets that went before it.
This is one of the reasons why ministers in the mid-2000s tried to come up with a system that reduced the number of ring-fenced grants, and consolidated the number of indicators that local councils and organisations needed to report against, and perhaps just as importantly, wrote into the guidance that local organisations had to co-operate with each other on jointly-agreed local targets that they had co-signed off with ministers.
It wasn’t a system without faults, but it never had the time to bed in and refine itself post-2010.
As a distant observer, it started to create some of the institutional networks that perhaps we could do with today. And not just at a senior executive level but at an operational/community-facing level too. This came up recently on BBC Radio Cambridgeshire (I am officially old). It was a feature about the pressure on hospitals due to chronic staff shortages.
The feature had a representatives from one of the hospitals stating that although they had staff shortages, they were supported by a significant number of ‘bank’ staff who come in at short notice to cover gaps – of which COVID-19 has meant there have been far, far more. These have been made worse in the longer term by successive funding cuts to training of nurses, including increasing tuition fees and cuts to bursaries – the extent of the latter forcing a U-turn from ministers only a few years later.
“What does Addenbrooke’s, Royal Papworth, and The Rosie Maternity Hospitals need from Cambridge?”
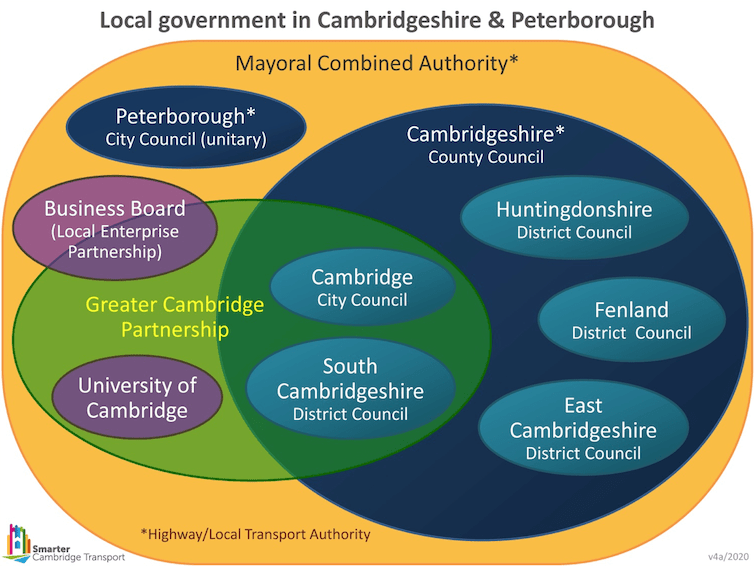
Half the challenge is defining Cambridge. It could be any of:
- The City of Cambridge,
- Greater Cambridge (City & South Cambridgeshire District),
- Cambridgeshire (The county), or
- the Cambridge economic sub-region (however you choose to define the radius of within which are affected by the economy of the city’s main industries and employers)
The next part of the challenge is asking what their needs are from different institutions and over different time scales.
- Cambridge City Council & South Cambridgeshire District Council – for this purpose a single body. (Not least because their town planning function is shared.
- Cambridgeshire County Council
- The Combined Authority & Mayor
- Network Rail and Highways England as national transport organisations reporting to ministers
- The privatised utilities – water, sewage, gas, electricity, telecommunications – and their regulators
- The police
- Local neighbourhood community organisations
- Larger charitable organisations
- Schools, colleges, universities, and training institutions
- National Government
- Sector-specific businesses – for example supermarkets, food suppliers, and businesses providing services directly to staff, patients, volunteers, and their families
Now take all of the above and consider the hospital needs over the time scales of:
- 6-12 months
- Five years
- 20 years
What do these look like for each of those three?
Now repeat all of the above for each of the different public services.
Then do the same for local communities: What are their needs from each of the different service areas in the short, medium, and long term?
This explains why future planning for public services is ever so complex. There are so many competing demands and needs coupled with so much uncertainty. (Which is why risk planning is ever so important – and in particular policy risk assessments).
Take one of the residential neighbourhoods in the vicinity of Addenbrooke’s and the Biomedical Campus – Queen Edith’s ward of Cambridge City Council, of whom Councillor Sam Davies MBE writes a weekly blog, and of whom Chris Rand produces the weekly newsletter and quarterly magazine. What are the needs of this part of South Cambridge, which institutions (if any) are responsible for them, and to what extent are those needs being met? Now ask the same questions for every single ward, neighbourhood, parish across the city and district.
“All of this sounds far too complicated and bureaucratic! Why bother?”
Good question.
But then how much of the complicatedness is a result of the artificial fragmentation of the public sector and public services where ministers past and present chose to move from democratic accountability to contractual accountability based on negotiated ‘service level agreements’?
Brief studies of your own area’s local history will show alternative public service structures very different to the ones we’re familiar with today – and certainly not without their problems. Some of the reasons for those structures were technological: the communications technologies did not allow for the centralisation we are familiar with today. So in Cambridge’s case, Cambridge Borough Council oversaw the building and running of:
- Cambridge Constabulary (via the Borough Council’s “Watch Committee”
- Cambridge Fire Brigade
- Cambridge’s magistrates – the Chief Magistrate always being the Mayor of Cambridge of that year
- Cambridge’s primary schools
- Cambridge’s library service
Again, don’t think for a moment these weren’t without their own problems – not least underfunding in an era of much lower taxation rates on the affluent prior to the world wars.
The next post (I hope) will look at who might need to do what over different time frames to improve our city.
If you are interested in the longer term future of Cambridge, and on what happens at the local democracy meetings where decisions are made, feel free to:
- Follow me on Twitter
- Like my Facebook page
- Consider a small subscription to help fund my continued research and reporting on local democracy in and around Cambridge.

