And now we have an official map showing us where it is. And in Cambridge, lots of it is ‘deemed inaccessible’
The map on p63 of the document titled “Green Infrastructure and Open Spaces Standards Framework Final Report” in the big list of planning documents shows how much.
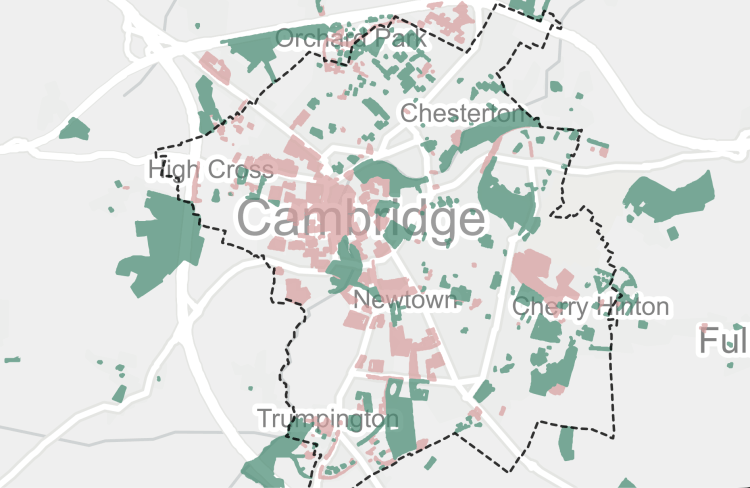
Above – Green Spaces – much of it college or private-school owned (plus the nature reserve at the East Cambridge Lakes) is highlighted in pink
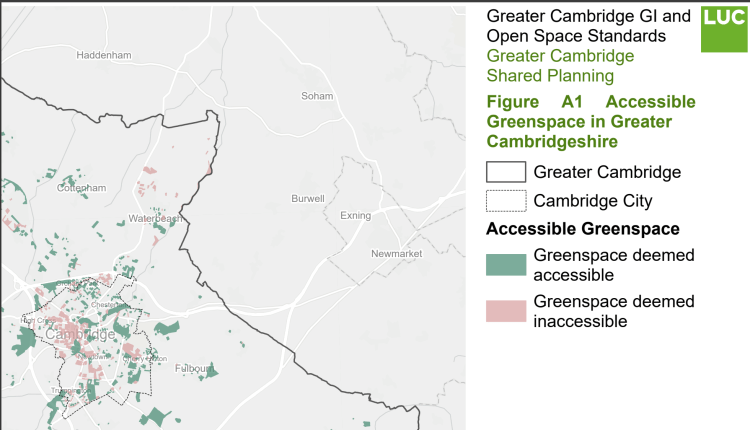
Above – the Key which if you’re lucky will take you through to the full document here.
The population continues to grow
(While water scarcity becomes even more of an issue.) The following page has tables containing mid-year estimates. Since the census of 2021, Cambridge’s population appears to have grown by around 10,000 people, to over 156,000 if the trends in the table below follow through.
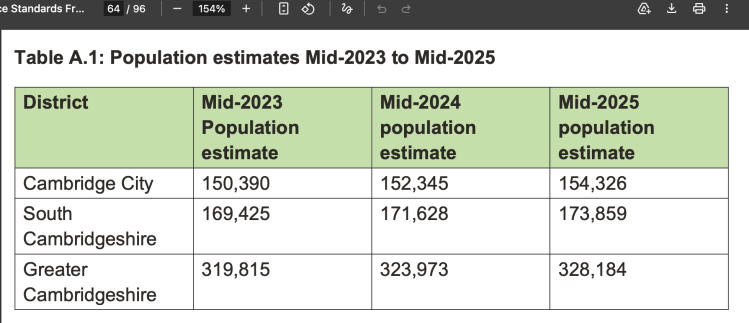
Above – Green Infrastructure and Open Space Standards Framework (2026) p64
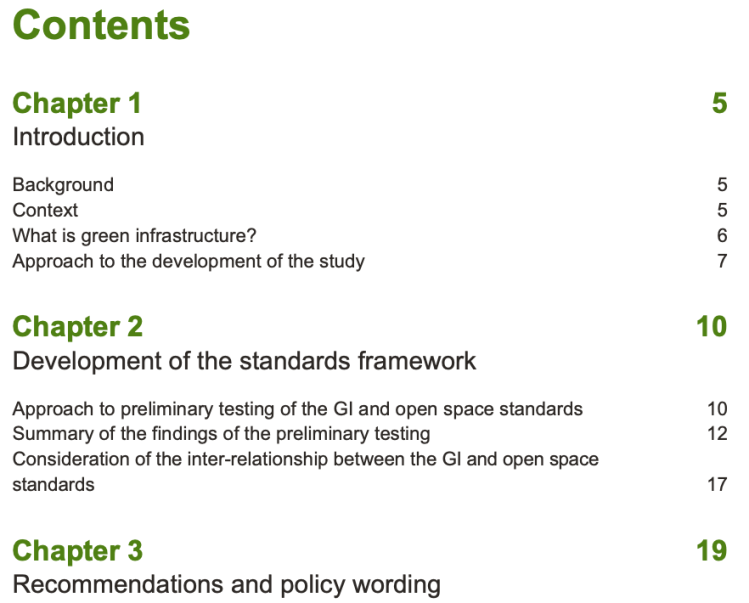
“What’s in the report?”
To make things easier, the main sections of interest to the majority are early on. Those of you with a strong interest in green spaces, trees, and the Green Belt will be interested in the evidence bases later on in the publication.
Above – Green Infrastructure and Open Space Standards Framework (2026) p3
Play space standards – 0.6 per 1,000 population **minimum**
This is on p33 of the report.
“The Play Space Standard should ensure a minimum of provision of equipped
play and informal youth spaces are provided within residential development, in
line with the current provision across both districts (0.6 / 1,000 of the population)”
Above – Green Infrastructure and Open Space Standards Framework (2026) p33
Tree canopy cover
Cambridgeshire is one of the least tree-covered counties in the country – mainly because what little there was in the north of the county was ploughed up in WWII due to the U-Boat blockade – resulting in much of the area falling under the plough and not being restored afterwards. Which also in part explains some of the re-wilding programmes taking place in our present age.
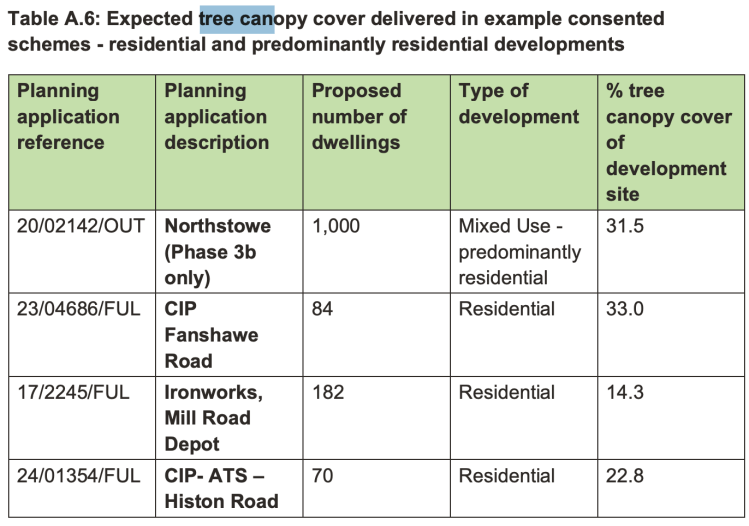
The report shows that it’s residential areas (especially the ones from the interwar-and-later developments) that have higher tree cover compared with commercial land uses. That said, we still have a long way to go to get to the 30% target.
“Of the developments tested, only two residential schemes achieved over 30% tree canopy cover (as advocated by the Woodland Trust as a minimum threshold of tree canopy cover on new development sites)”
Above – Green Infrastructure and Open Space Standards Framework (2026) p16
Some of the recent developments were featued in the report on tree canopy cover.
Additionally, I was struck by how many people are expected to work on the Technology Park off Fulbourn Road given the lack of amenities in the area
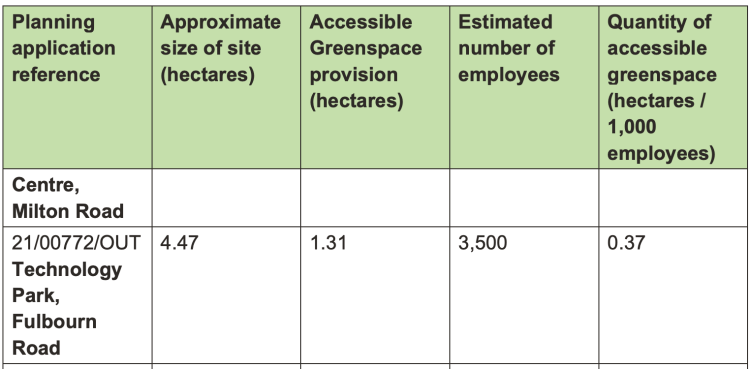
Above – 3,500 employees estimated on the Technology Park on Fulbourn Road
In the neighbourhood of the Technology Park (owned by Peterhouse, Cambridge)
It then becomes a question of how far employees and staff are willing to walk if they want to get off the site during breaks / lunchtimes.
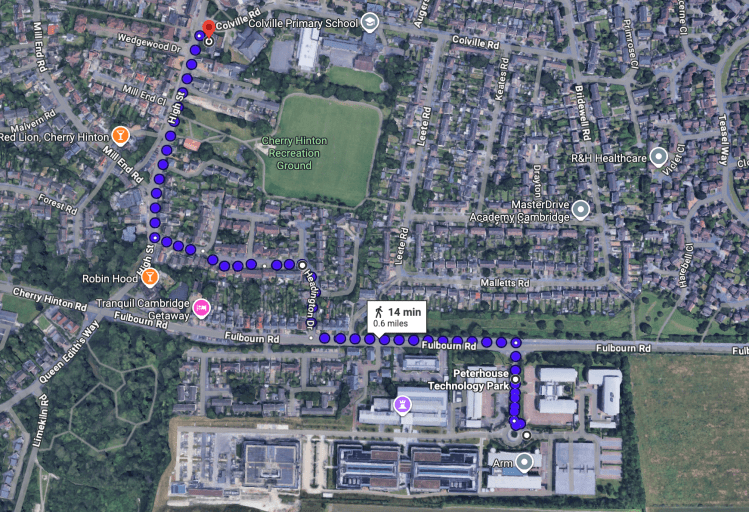
Above – the estimated 15 minute walk from ARM’s HQ to Cherry Hinton High Street on G-Maps
That neighbourhood also includes Colville Primary School, and the many residents in the post-war council housing along with the recently built higher density council homes that were funded through a combination of Housing Revenue Account funding and also devolution funding negotiated by former councillors Lewis Herbert and Kevin Price from Chancellor George Osborne in return for Cambridge City Council signing up to the Combined Authority a decade ago.
Also within the neighbourhood are Queen Emma Primary School, the Netherhall School (secondary) and Oakes Sixth Form Centre which emerged out of the Netherhall Sixth Form.
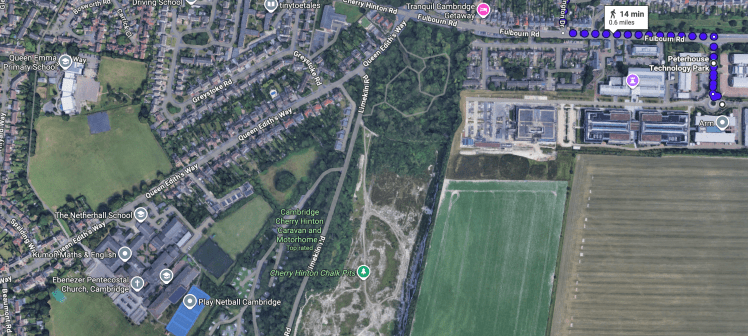
Above – The Technology Park and the neighbourhood to its west
Which then makes me wonder what the institutional relationships between the Technology Park tenants and local residents should be, and what additional facilities should be built (and where) given that Cherry Hinton Village’s population in 2021 was just over 9,000. Only 3,500 people seems like *a lot of people* to have around during the daytime – as the increased motor traffic reflects.
There’s also a much broader conversation to have on new rail-based transport links especially given the number of employees are due to grow on the Capital Park site by Fulbourn Hospital.
“Non-Technical Summary….should be viewed in the light of the proposed 1,349 car parking spaces, and the possible total number of employees being between 4,500 and 6,750 (based upon the ‘rule-of-thumb’ of 8-12 sqm of gross internal floor area per employee).”
Above – Joint Development Control Committee Report 27 Oct 2021, p48
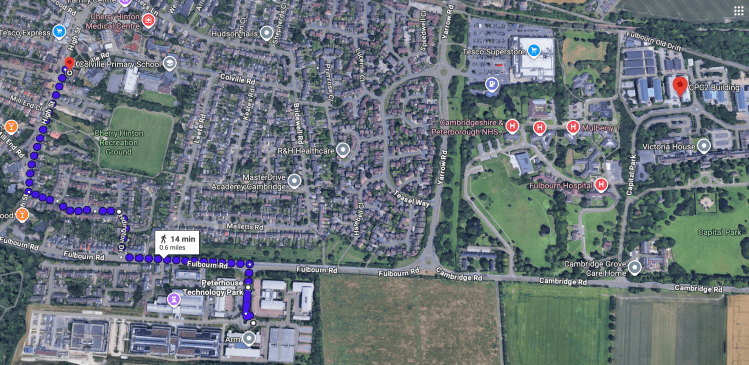
Above – South East Cherry Hinton/East Cambridge on G-Maps with Cambridge Technology Park (bottom left) and Capital Park, Fulbourn (top right) by the old level crossing at Fulbourn Old Drift , now closed off but that might make a useful light rail stop.
But that’s all a separate conversation – not least because Fulbourn Hospital is a site of major change in the draft local plan.
If you are interested in the longer term future of Cambridge, and on what happens at the local democracy meetings where decisions are made, feel free to:
- Follow me on BSky
- Spot me on LinkedIn
- Like my Facebook page
- Consider a small donation to help fund my continued research and reporting on local democracy in and around Cambridge


