
Along with Cambridgeshire County Council’s Quality of Life report, what do they tell us about the state of the county?
Image: The Trials of Democracy Cambridge logo by Hilary Cox Condron – read about the project here. I hope it gets another round of funding for the transition to the unitary council structures.
You can:
- Browse through the Cambridge: State of the City 2026 report at item 12 here, along with
- Cambridge City Portrait: State of the City 2023:
https://www.cambridge.gov.uk/media/12916/state-of-the-city-report-2023.pdf - State of the City Annual Report 2024:
https://www.cambridge.gov.uk/media/jdpempkq/state-of-the-city-2024-update.pdf - State of the City Annual Report 2025:
https://www.cambridge.gov.uk/media/be1ds2kz/state-of-the-city-2025-update.pdf
- Cambridge City Portrait: State of the City 2023:
- Browse through the Cambridgeshire Quality of Life Report (See here, scroll to the foot of the page)
Our polarised city
The one statistic that felt like a metaphorical gut-punch was the disposable income graph
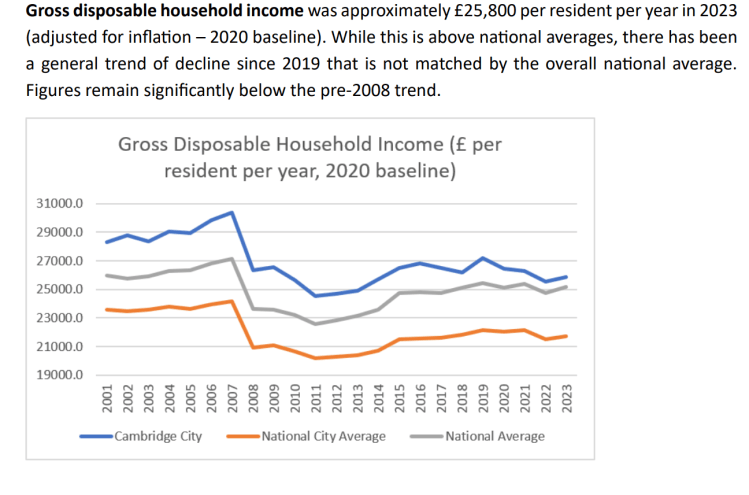
Above – Gross disposable household income, Cambridge and comparators, State of the City 2026, p18 of the second report at item 12 here.
That collapse from £31,000 to below £25,000 in three years (mindful of George Osbornes austerity budget in 2010/11 that resulted in widespread job losses – including my own) it’s clear that the country has never recovered from the catastrophe caused by the bankers, weak regulators, compliant politicians and compromised academics. See Inside Job (2010) and the BBC’s summary here from the same year..
Cambridge is unaffordable for people on low incomes in rented properties
But then we knew that anyway – and have known this for years.
“The lower quartile house price was 11.2 times the lower quartile pay in 2025, though there was a steeper decrease from 2024, where the figure stood at 12.1. This is worse relative to the rest of the nation than the overall housing affordability ratio – the low-income housing affordability average for cities was 7.1, and the overall average was 6.8.”
Which is still grim. Surprisingly there is no mention of the wages to rents figure.
There was a notable sharp change in housing tenure when the pandemic hit.
The fall in the number of homes owned outright by 4,000 between 2021-2022 and the rise in private rent by around 3,000 gives the impression that a number of owner-occupiers died during the pandemic, and that when their former properties were put on the market, around three-quarters ended up in the hands of already-wealthy property owners to put out onto the rental market, while only a quarter went to people with mortgages (rising by just over 1,000).
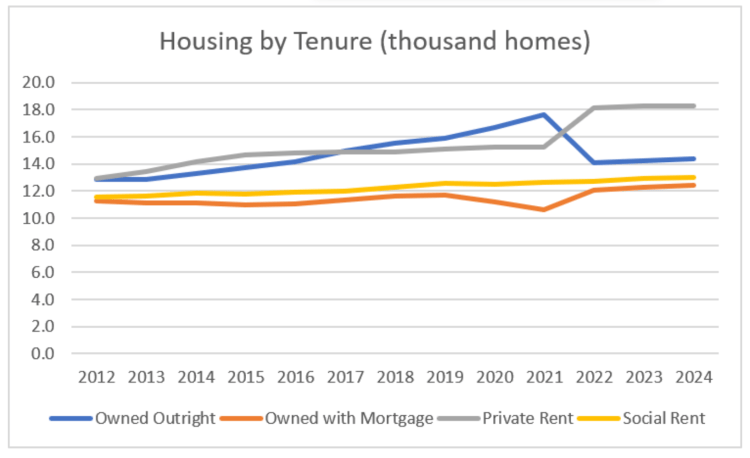
Above – Housing Tenure in Cambridge 2012-2024. State of the City 2026, p23 of the second report at item 12 here.
The whole report leaves me feeling somewhat cold and disconnected.
I think it’s a combination of the background mood music in Politics (local, national, international) and the inability of institutions of the state to respond comprehensively to those challenges. That plus my own situation not helped by a sleepless night and a zombie-like day (missing a music rehearsal too).
“How does the Cambridge City Council annual report 2025/26 read?”
It’s the first report at item 12 here.
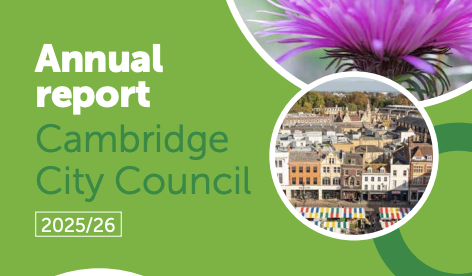
Above – Cambridge City Council’s annual report 2025/26
The annual report is inevitably full of numbers, but having spent the last quarter of a century on the receiving end of ministers reading out lists of numbers and statistics, the numbers are not connecting with me.
“What would an annex to the report featuring human case studies read like?”
For example on p6 of the report there are a number of items listed.
“Helped more than 300 refugees, including 138 children, settle into life in Cambridge…”
What might a double-page feature of some of the refugees getting on with say lifelong permanent residents across a range of day-to-day interactions and activities feature? Could these help counter the deluge of hate coming from the print press?
“Carried out 687 food safety inspections, helping 98% of food businesses meet standards.”
What might a feature of a business that failed an inspection but which then turned things around and scored highly upon re-inspection include? (With the added benefit of providing a more up-to-date information for online search engines)
“Held a community health and fitness day for older people in South Cambridge, leading to over 600 conversations and more than 100 people getting extra help.”
What was the impact of that extra help? What difference did it make to the residents that got that extra help? (i.e. including quotations in their own words).
“Created a hectare of new wetland habitats at Logan’s Meadow Nature Reserve and launched the Cambridge Butterfly Trail across 30 parks and open spaces”
Could we have some features of people making use of those butterfly trails?
In the longer term the new unitary council could commission the city’s further education colleges to source and co-produce some of the stories – in particular the media students, with the colleges students receiving grants/payments in return to spend on improvements to their college’s shared facilities. With the existing Match My Project scheme (please update the web page!) this is something that local businesses could be invited to sponsor.
“Anything on the Quality of Life report by the County Council?”
Lots – but the polarisation of both wealth and Politics makes it hard to figure out which bits apply to Cambridge and which ones don’t with the overall averages.
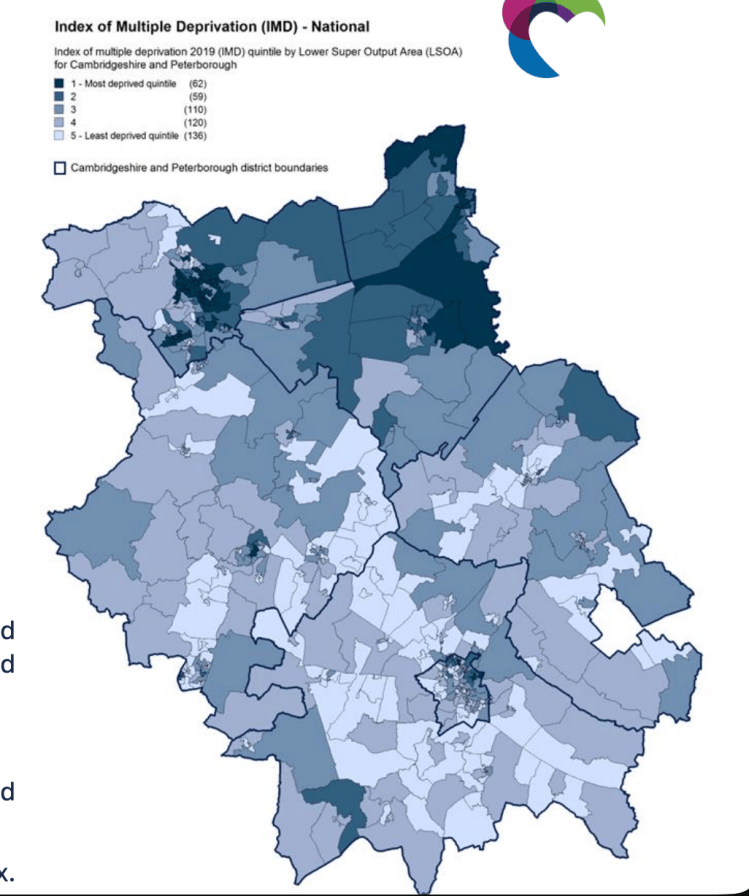
Above – Index of Multiple Deprivation, Cambridgeshire & Peterborough Health Inequalities Data Pack 2024/25 p8. Cambridgeshire & Peterborough ICS published July 2025
The contrast between South Cambridgeshire District, and the south/western areas of Cambridge City vs Fenland District in North Cambridgeshire remain stark.
As things stand, local government and local public service providers remain unable to do more than react to the most acute problems – investment in prevention in the face of huge inequalities and the inability to raise resources from extreme wealth (especially in/around Cambridge – and in particular wealth extraction tied to things like land values and property values) remains a huge barrier. One that needs changes in government policy and new legislation to be enacted by Parliament.
Combined Authority Board meeting – 23 September 2026.
Oh, that’s today. (It’s just gone midnight)
The meeting papers are here with livestream link.
Have a read of the Director’s update at item 11. Also:
“Active Travel Local Transport”
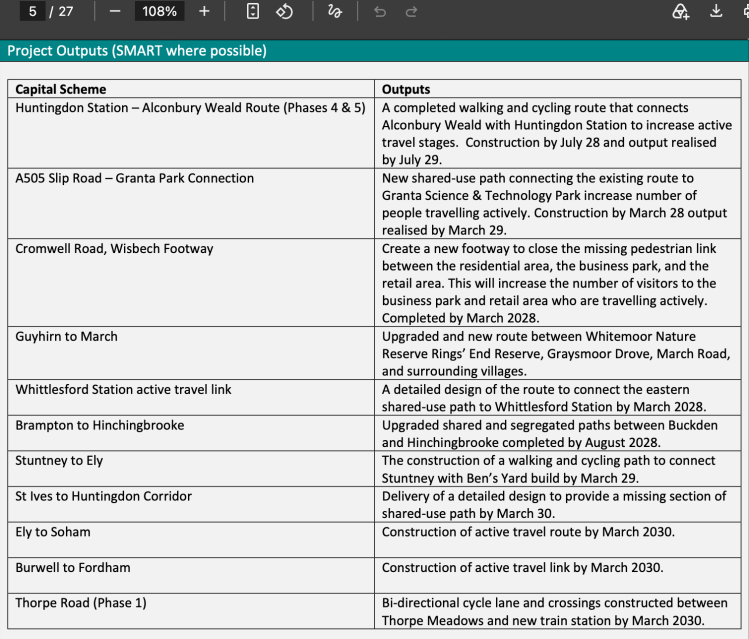
There’s a business case asking for approval of over £24million of spending over the next four years. You can read the business case at Annex A Item 4 of the Funding Committee’s meeting of 07 September (which recommended approval to the Board) here.
The infrastructure improvements are on p5 of Annex A, which I’ve listed below. There are a host of other things covered in the subsequent pages.
Combined Authority to get new Active Travel Officer (essential for planning application consultation responses)
For the ‘revenue’ spending (i.e. not on building work or anything that creates an asset), the following will have happened by 2029.
- Full time Active Travel Officer for CPCA [the appointment of]
- Staff training for 10+ colleagues
- Conference attendance x 6+ colleagues
- Development of pipeline through design, survey and modelling
- Creation of a region-wide active travel network map
- Planning applications support
Note the pipeline of further improvements – this makes it more likely that bids for future grants will be successful because as we saw with the Princess and Hanover Court redevelopment, ministers like ‘shovel-ready’ schemes such as that one which confirmed that new social homes would be part of the mix of replacement housing for obsolete 1960s blocks off Hills Road and Trumpington Road.
Mobile Hub Strategy – transport
I think I missed this in the Transport Committee earlier this month but I like a data map and these on commuting may interest several of you. The maps below are:\
- Number of ‘travel to work trips of less than 10km (Census 2021 figures)
- Number of ‘travel to work trips of more than 10km
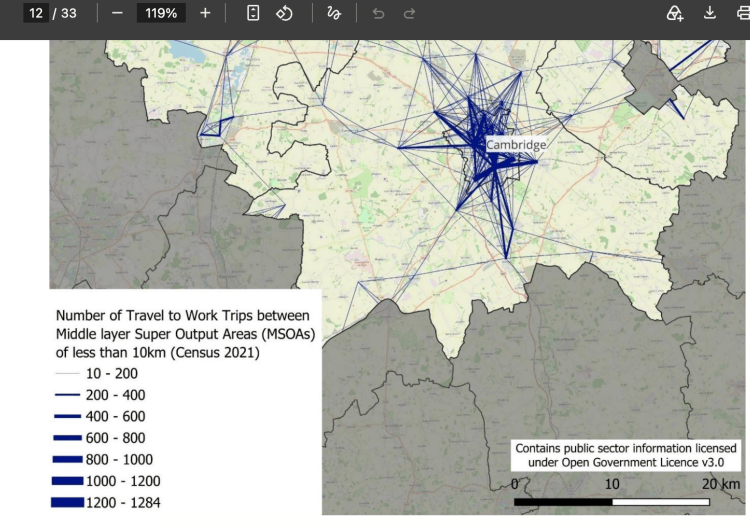
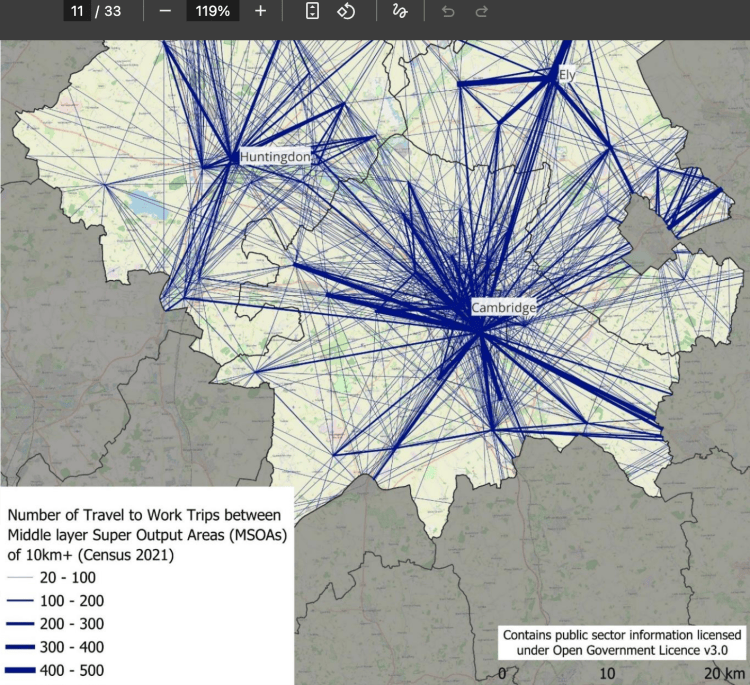
Above – Transport Committee 09 September 2026 item 12 Appendix B pages 11-12
Which helps decision-makers plan for future light rail and mass transit infrastructure that doesn’t involve more buses on already congested roads.
If you are interested in the longer term future of Cambridge, and on what happens at the local democracy meetings where decisions are made, feel free to:
- Follow me on BSky
- Spot me on LinkedIn
- Like my Facebook page
- Consider a small donation to help fund my continued research and reporting on local democracy in and around Cambridge


